

There are several packages available for Python to import CSV files. However, I prefer using the pandas package. Here is an example of how to import a csv file to a variable in Python using pandas.
Note: This example is based on a Python 3.10.x virtual environment in Visual Studio Code on macOS.
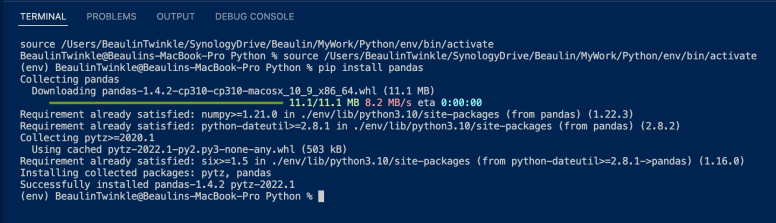
Install pandas
I have already explained how to install a python package in a virtual environment in visual studio code. Here is the pip installation code for pandas.
pip install pandas
Syntax
Here is the syntax of the code to be used to import a csv file to a variable.
# Import the pandas module
import pandas as ps

# Use read_csv in pandas to read the csv file and assign it to a variable
df = ps.read_csv('Path of the source csv file')
Here read_csv is a function in pandas, which reads the csv files and returns it as a 2 dimensional array called DataFrame.
Examples
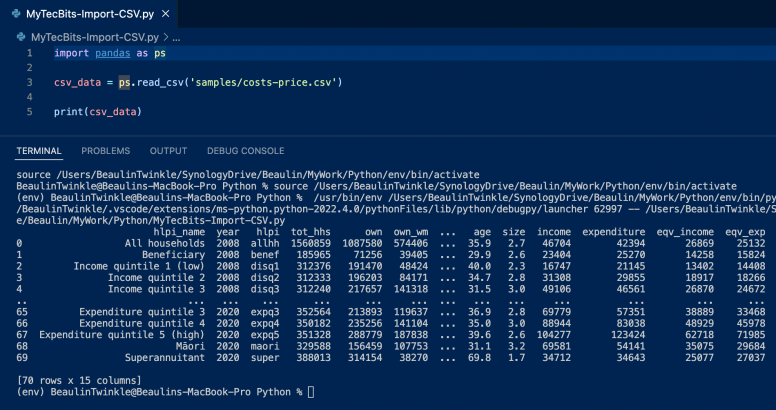
Import a CSV file to a variable
Here is a simple example on how to import a csv file called costs-price.csv from a folder called samples using the pandas.read_csv function. Then assigning the retrieved DataFrame or the 2 dimensional array to a variable. Finally print the DataFrame to the terminal
import pandas as ps

csv_data = ps.read_csv('samples/costs-price.csv')

print(csv_data)
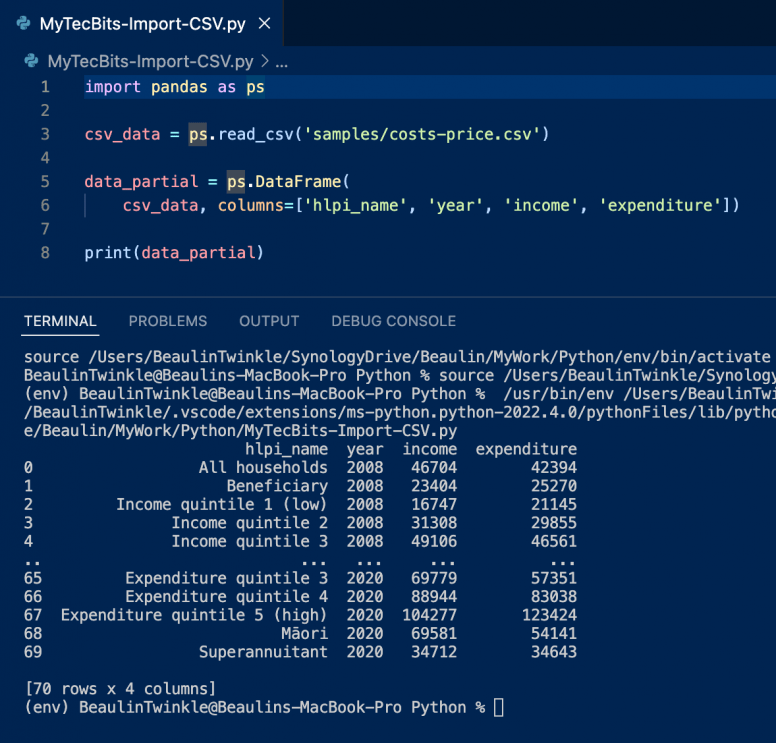
Segregating few columns from the imported data
In the previous example, after importing the data from csv file, I have just printed the data. If you want to work with just a few selected columns, then you can use the pandas.DataFrame() class. Let’s modify the above example to list down the columns hlpi_name, year, income and expenditure.
import pandas as ps

csv_data = ps.read_csv('samples/costs-price.csv')

data_partial = ps.DataFrame(
    csv_data, columns=['hlpi_name', 'year', 'income', 'expenditure'])

print(data_partial)
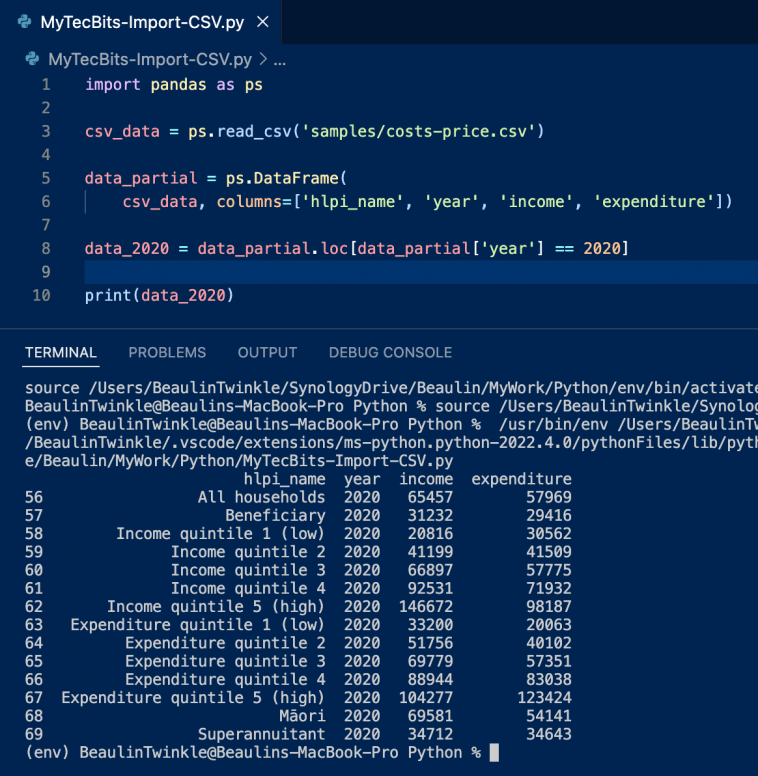
Filtering rows based on column value
Furthermore, if you want to filter the number of records based on values in a column, then we can use the pandas.DataFrame.loc[] property. In our example, let us display only the records which are for the year 2020.
import pandas as ps

csv_data = ps.read_csv('samples/costs-price.csv')

data_partial = ps.DataFrame(
    csv_data, columns=['hlpi_name', 'year', 'income', 'expenditure'])

data_2020 = data_partial.loc[data_partial['year'] == 2020 ]

print(data_2020)
Reference
- More about the pandas package at GitHub.
- More about pandas.DataFrame at Pandas Documentation.