Performance issues on a production SQL Server can be tracked using various means. In case if you want to track and find the stored procedures which are running for long time say more than a second, you can use the tools like extended events, profiler or server-side trace. In this article, I’ll use both the extended events method and the profiler method to find long running stored procedures on SQL Server.
Jump to any of the methods as you wish:
- Using Extended Events: Jump to topic ↓
- Using Profiler Trace: Jump to topic ↓
Find Long Running Stored Procedures Using Extended Events
In my earlier article, I wrote a brief details about SQL Server Extended Events and a simple illustration on how to use them. In this article, I’ll explain with step by step instruction on how to use extended events using SSMS to find the stored procedures running for more than a second on any database on a SQL Server. Follow the below steps.
Creating an Extended Events Session
Creating A Session
- In SQL Server Management Studio 2016 or higher, go to Object Explorer > Management > Extended Events > Sessions.
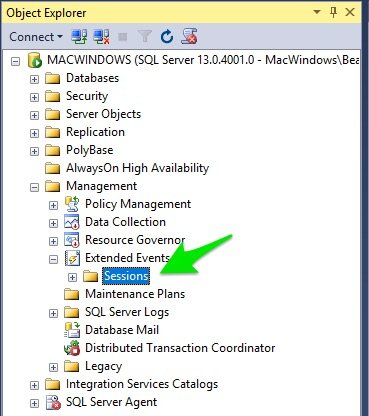
- Right-click the Sessions folder and from the right-click menu select New Session...
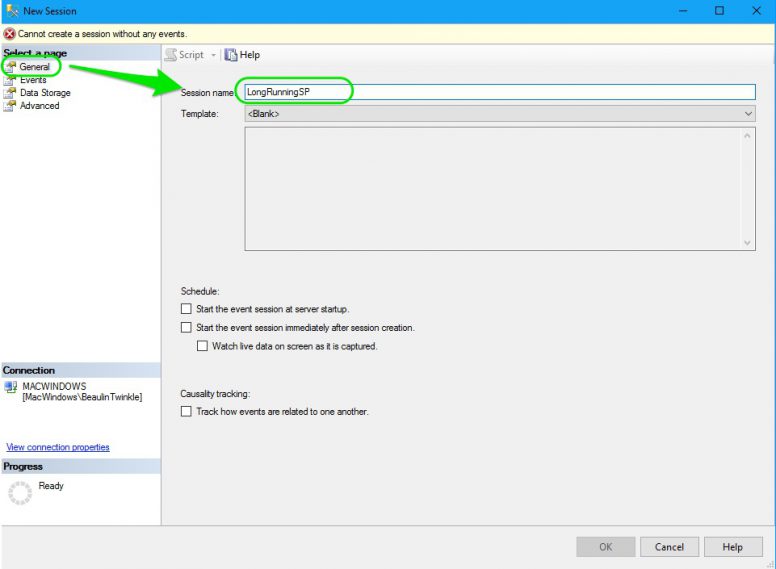
- In the New Session pop-up window, select General from the left panel and enter Session Name. I’ve named it LongRunningSP.
Add Events & Actions
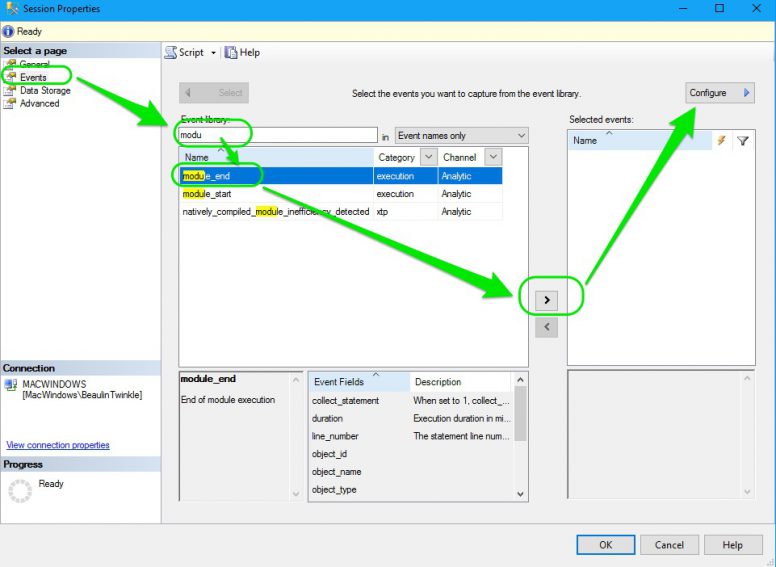
- Now, choose Events page from the left panel. In the Event Library, search box, type module. From the filtered events, select module_end event and click the right arrow. The module_end event is now listed under the Selected events list in the right.
- Then, select the Configure button at the right top, above the selected events. The configuration section will emerge from the right side.
- Now, from the Global Fields (Actions), select the actions by checking the check box. For this illustration I’ve selected, database_name and sql_text. If needed you can select more events.
Add Filters
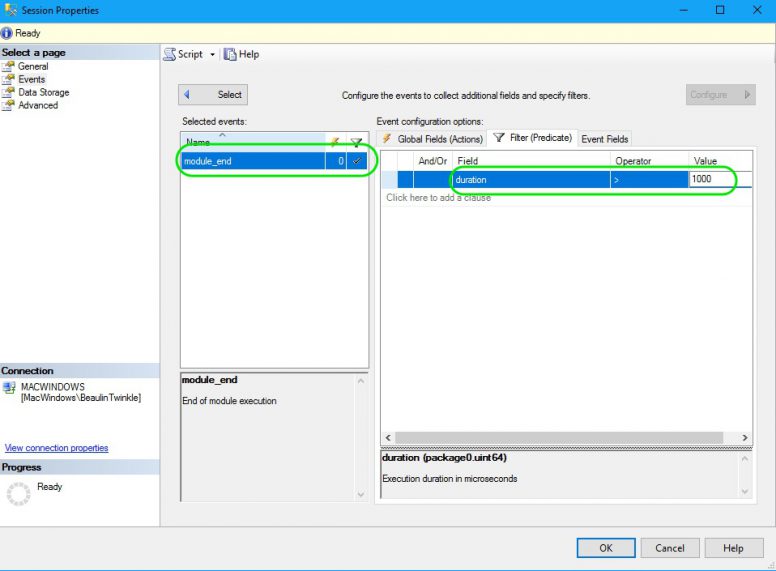
- Now, go to the Filter(predicate) panel. Click inside the filter panel to add a filter clause. In Field, select duration. Under operator select >=. Under Value enter 1000. This filter clause will track and collect only the queries which are running for 1000 Milliseconds (1 second) or higher.
Set Storage Location
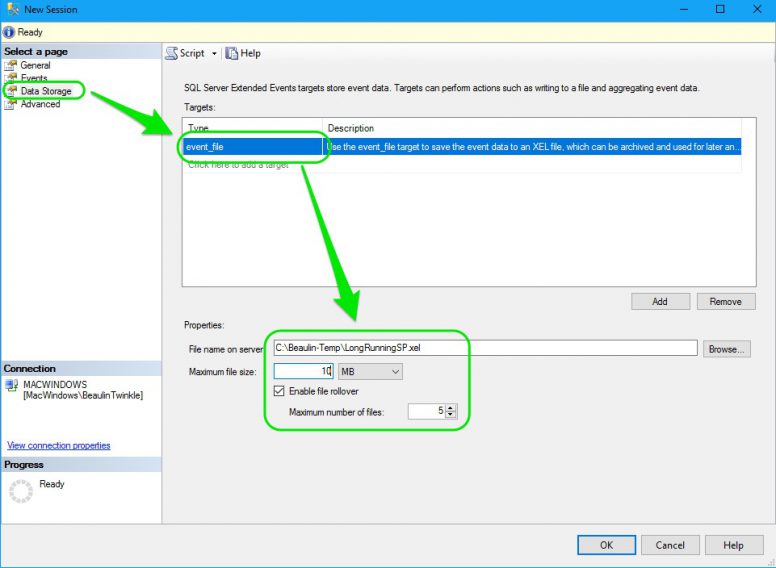
- You need to set a location and method to store the collected action and events. So, choose the Data Storage page from the left panel. In the main panel, under Type, select event_file. Select a folder and file name in File name on server field. Change the Maximum file size if needed. By default the maximum file size will be 1 GB. For this illustration I’ve changed it to 10 MB.
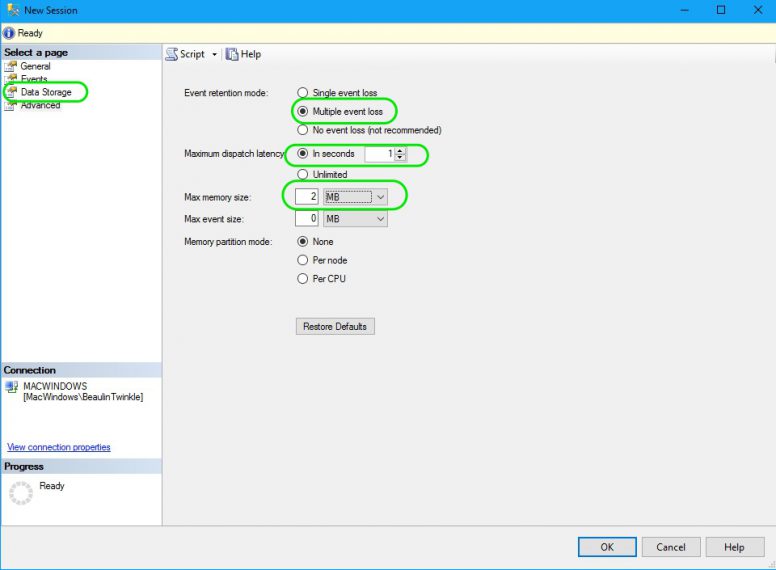
- Now, go to the Advanced page. Change the event retention mode to Multiple event loss. Enter Maximum dispatch latency as 1 second. Change the Maximum event size.
Save The Session
- Finally, press the OK button.
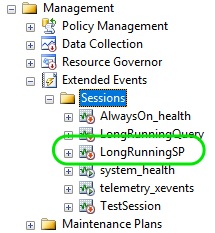
- To check whether the session is created properly, go to Object Explorer > Management > Extended Events > Sessions. You will see the new session LongRunningSP. You can edit the session by right-clicking and select edit in right-click menu.
Starting the Extended Event Sessions & Collecting Data
By default, the session will be in inactive state. Follow the below steps to start the session and track the events.
- To start the xEvent session, right-click the session LongRunningSP and select Start Session in the right-click menu. The session will start collecting the events and store them in the location you have set.
- For illustration purpose, I’ve created a stored procedure which executes a select statement after a delay of 2 seconds. I’ve executed this stored procedure couple of times.
CREATE PROCEDURE MyTecBitsToDelay
AS
BEGIN
	WAITFOR DELAY '00:00:02';
	Select getdate()
END
GO
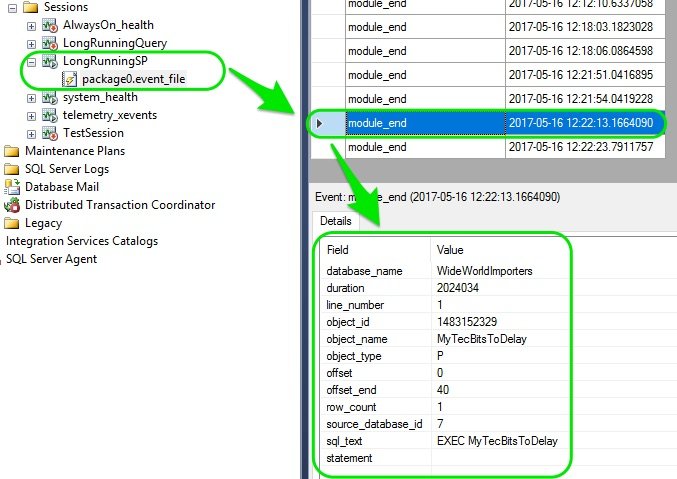
- To check the long running stored procedures collected by the session, double-click on the event file package0.event_file underneath the session. A query window will open with the list of tracked events. On selecting an event, you can see the details of the stored procedure in the result window.
- To disable the session and to stop it from collecting the data, right-click the session name and select Stop Session.
Find Long Running Stored Procedures Using Profiler
- Launch Profiler.
- From the File menu, select New Trace… .
- In the login window, select the sever and login.
- In the trace profiler window, Enter a name for the trace under the General section.
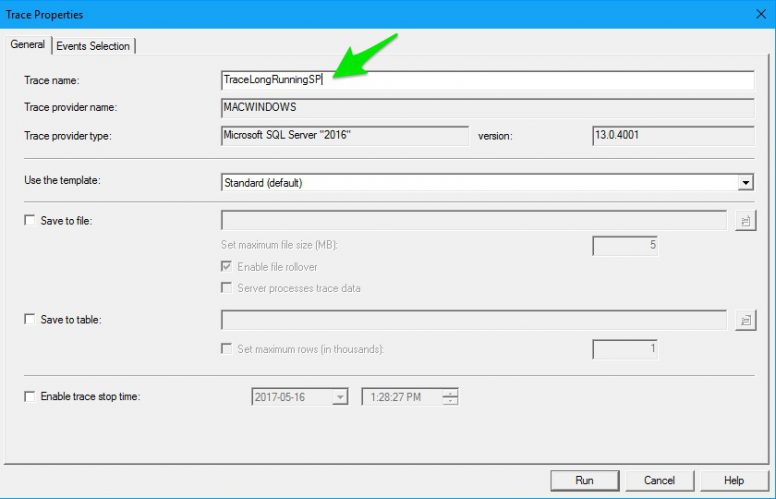
- After entering a name for the trace, go to the Events Section and un-select all the pre-selected events.
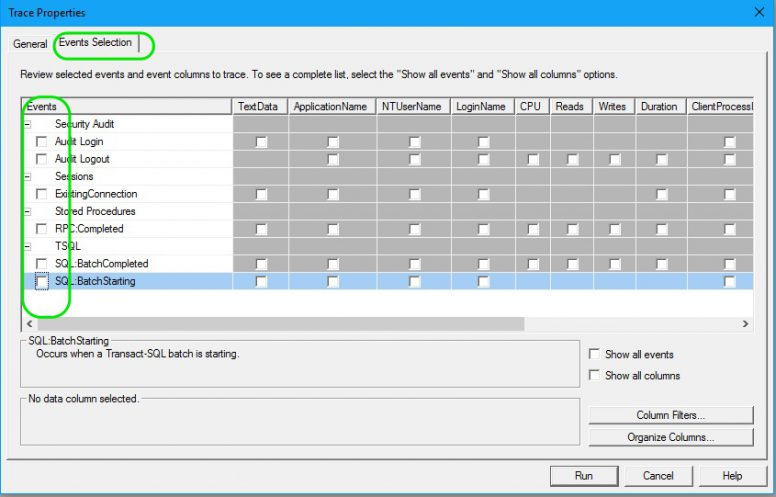
- Now, select the Show all events and Show all columns check box, so as all the vents are displayed in the grid above.
- In the events grid, go to Stored Procedures group and select the event SP:Completed.
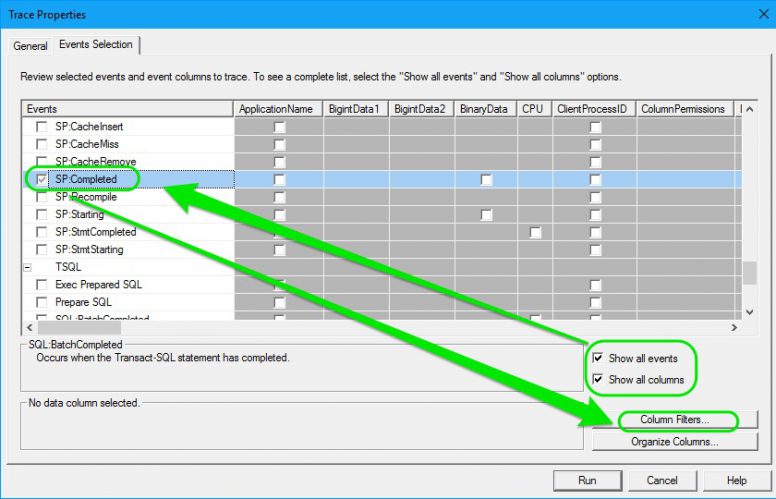
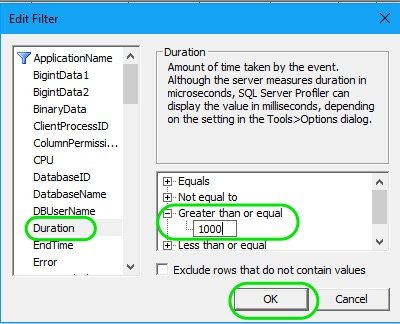
- After selecting the event, you have to add a filter to trace the procedures running for more than a second i.e. 1000 milliseconds. To set the filter, press Column Filters button at the right bottom.
- In the Filter window, select Duration from the left panel. From the right panel, select Greater than or equal and enter 1000 in the box. Then, press OK on the filter window.
- Finally, press the Run button at the bottom.
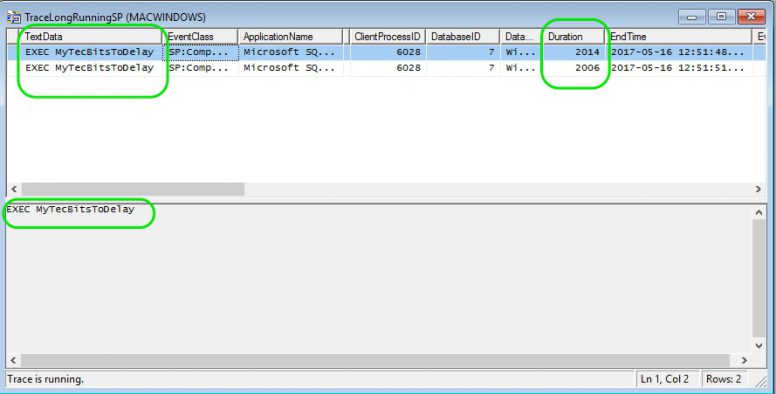
- The trace will be running and you can watch the live data. For illustration purpose, I’ve created a stored procedure called MyTecBitsToDelay and executed it couple of times. On execution, this stored procedure will wait for 2 seconds and run a select statement.
- If you notice the trace window, You can see the captured stored procedure.
- Once you have completed the tracing, don’t forget to stop the trace by pressing the Stop icon at the tool bar or by closing the trace window.
After identifying the long running stored procedure, you can fine tune it. Do not forget to clear the cache an buffer of the stored procedure while analyzing it.
Related
- Easy steps to find and log dead locks and blocks in SQL Server using extended events.
Reference
- Brief detail about XEvents.
- About SQL Server XEvents at Microsoft Docs.
