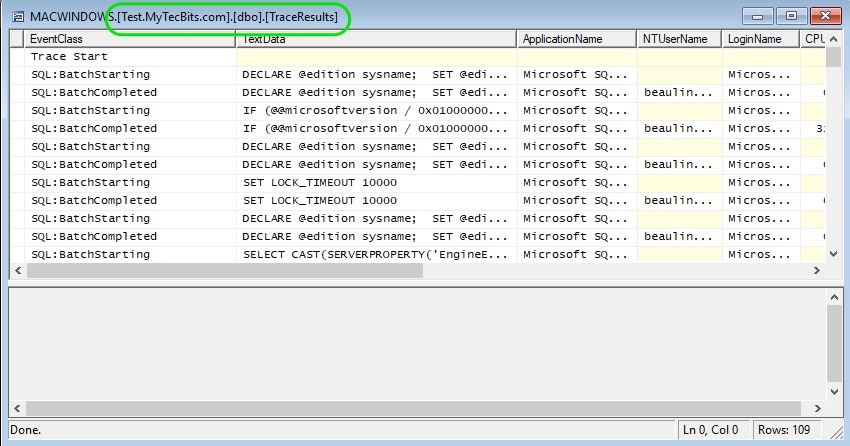
Often while using profiler trace to capture the events and statements, you may need to save them somewhere to do further analyzes later. There are several ways to save the trace results. You can save is as a file with .trc extension, a table in database, as XML file,… etc. The way I prefer for saving profiler trace results is to store them to a table in SQL Server database. Then, you can use it for further analysis when needed. As the trace result is stored in a table, you can easily filter the events using simple select statement using SSMS. If needed you can even open the table back in profiler as a trace window.
Steps For Saving Profiler Trace Results To Table
- After capturing the events in profiler, stop the trace.
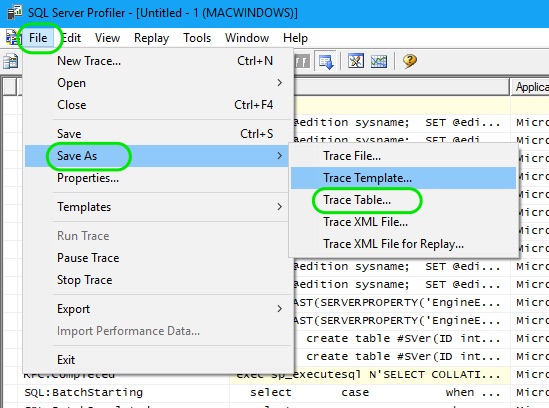
- Go to File >> Save Us >> Trace Table…
- In the connection screen, enter the SQL Server credentials and press Connect.
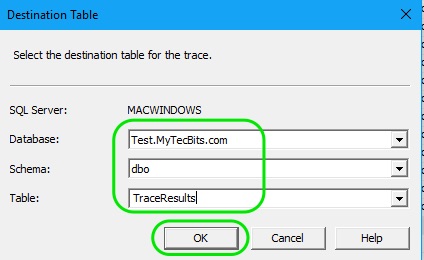
- Now, In the destination table screen, Select the Database, Schema and enter a table name in the Table field. Then press OK.
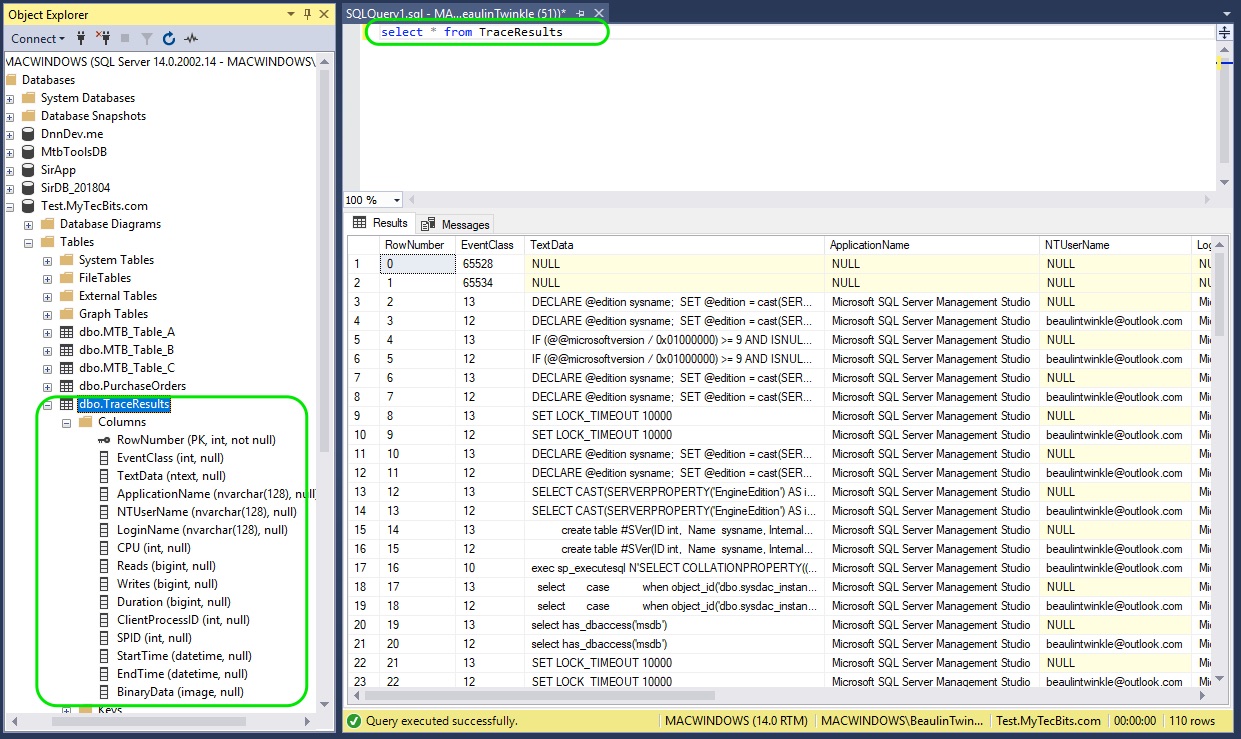
- The trace result is now stored in the database table. To check it, launch SSMS and look for the table and its contents.
Opening The Saved Trace Results Table Back In Profiler
- To open the trace results saved in a table from the profiler, go to File >> Open >> Trace Table….
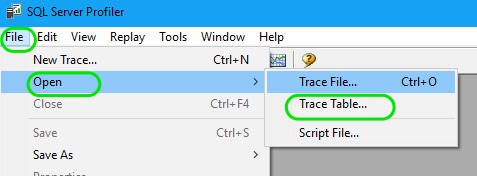
- Now, In the connection screen, enter the SQL Server credentials and press Connect.
- In the destination table screen, Select the Database, Schema and Table in which the trace results are stored. Then press OK.
- The results will now open in the profiler trace window.
