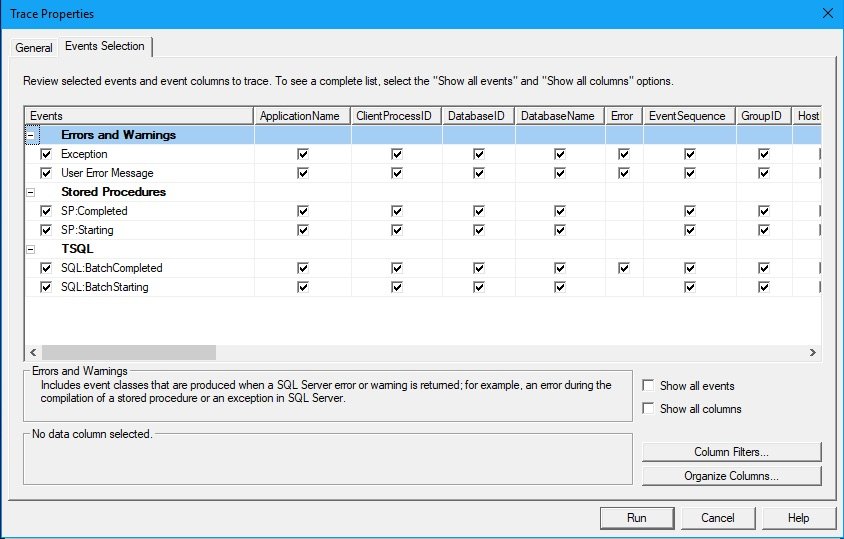
Using SQL Server profiler is the easiest way to capture the errors and exceptions occurring in a single or multiple databases. Here are the settings needed in the profiler to capture the error messages occurred in the database.
Steps To Trace Errors And Exceptions Using Profiler
- Launch the Profiler.
- From the File menu, select New Trace… .
- In the login window, select the sever and login.
- In the Trace Properties window, under General tab, for Use the template field select Blank.
- Go to the Events Selections tab. Expand the Errors and Warnings event category and select:
- Exception
- User Error Message
- Then expand the event category Stored Procedures and select these events:
- RPC:Completed
- RPC:Starting
- Expand TSQL event category and select:
- SQL:BatchStarting
- SQL:BatchCompleted

- Optionally, if you want to trace the errors against a specific database, then follow these steps:
- Select the check box Show all columns.
- Press the Columns Filters… button below.
- In the Filter pop-up window, from the left panel select DatabaseName.
- From the right panel, under Like tree node, enter the database name.
- and press OK.
- Then, press Run button to start the trace.
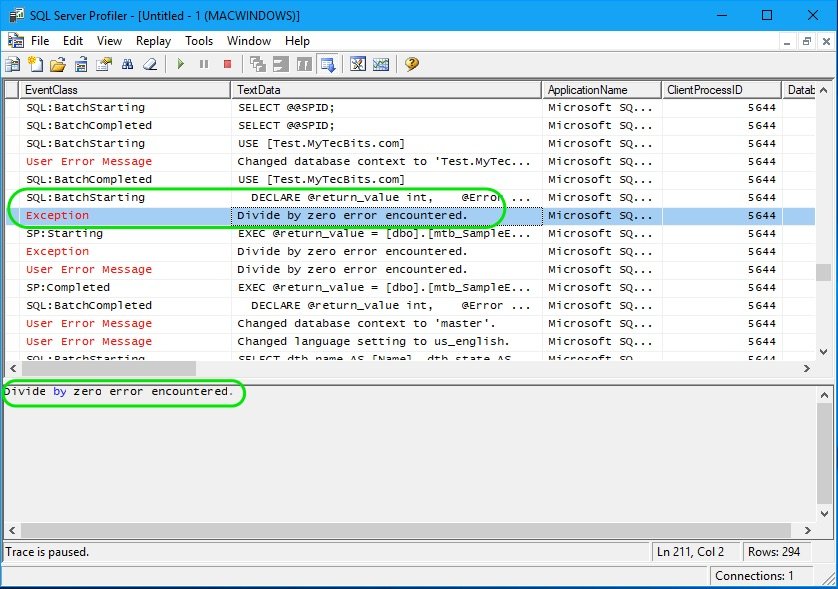
Now the trace will capture the exceptions and user errors. If you notice the below profiler trace screen shot, you can see the captured exception. Just above exception event, you can see the SQL:BatchStarting event which have captured the statement causing the exception.

Next Steps
- If the exception or error is from a stored procedure having hundreds of statements, then you may need to further filter the trace to trap the exact statement causing the exception. To do so you can follow the steps in my earlier article on How to debug queries inside a specific stored procedure?.
- To find the specific statement throwing the exception from a batch, then include the event SQL:StmtStarting under the category TSQL.
