SQL Server Profiler is a useful tool to capture all the actions generated in an instance of SQL Server. Profiler can be used even on a production server. However, tracking all the events generated on a production SQL Server instance is definitely not a good idea as it generated tremendous overhead on the execution of queries and statements. To reduce the overhead, you can use the filter options to reduce the number of events captured by the profiler trace. Now, we will see how to use the filters and minimize the trace overhead.
Steps To Use Filters In Profiler
First Level Of Filter
- From the profiler trace window, go to menu Files > Properties.
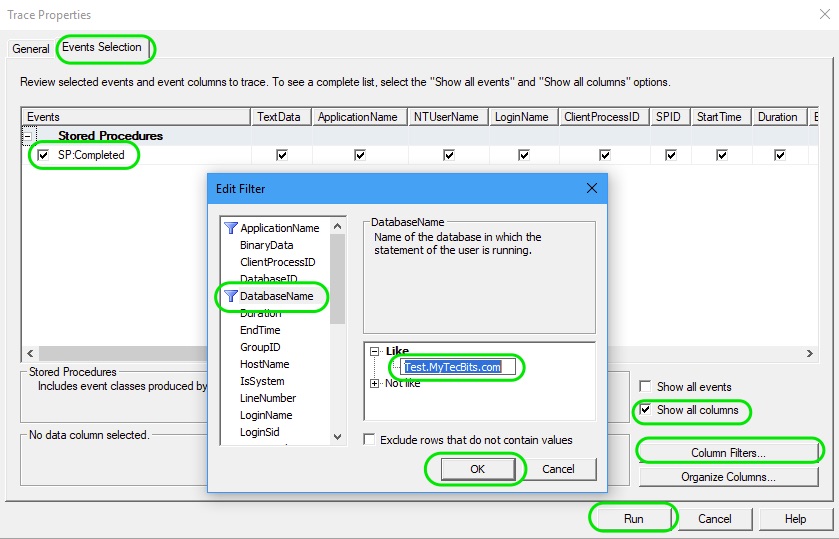
- In the Trace Properties window, go to Events Selections tab.
- From the left Events panel, you can choose only the events only you want to capture and work with. This is the first level of filter. This event selection helps you to eliminate a huge number of events happening on the server instance. Follow these steps to select or un-select events.
- By default, there will be some events selected in the events selection tab. You may not need all of them or you may need some other events.
- If you do not want any of the pre-selected events, then un-select them.
- If you need to choose some other event, then select the option Show all events. This will show all the event categories and the event classes underneath the categories.
- For selecting one or few of the event classes, expand the event category and select the event class you need.
- If you want to select all the event classes under a specific category, then select the category, right-click and choose Select Event Category.
Second Level Of Filter
- The second level of filter is by using the column filters option. To use this filter:
- Select the option Show all columns.
- Then press Column Filters… button to pop-up the Edit Filter window.
- In the edit filter window, you can select one or more filter types at the left panel and enter the filter condition at the right panel.
- Few of the most common column filters are:
- DatabaseName: You can filter the trace to capture only the events from one or many databases using the Like condition. Or, you can exclude events form one or more databases using the Not Like condition.
- ApplicationName: You can specify the name of the client application if you want to filter the queries executed from client application. For example if you are using .NET SQL Client to access the database use the name as .Net SqlClient Data provider.
- Duration: Useful for capturing low performing queries or stored procedures or batches running beyond certain duration.
- Login: Useful to trace the events from a specific or set of logins.
- ObjectName: Useful to capture one or more objects with their name. For example, if you want to trace only a specific stored procedure then use this filter to specify the stored procedure’s name.
- Once you have set all the filters, press OK to close the Edit Filter window.
- Finally press the Run button to start the trace.

