You might have already know that the SQL Server Profiler is now deprecated. Even though it’s still available in SQL Server 2016, it will be removed in later version (read more). So, what’s the alternative for profiler? The best alternative for profiler is SQL Server Extended Events. What are Extended Events? Let’s see in this article. We’ll also see the advantages of Extended Events over Profiler and a simple illustration of using the XEvents.
What are Extended Events in SQL Server?
SQL Server Extended Events is an architecture Introduced in SQL Server 2008 which helps the database administrator or programmers to collect information to find any performance issues or bottlenecks in the SQL Server. The user has full control over it, to collect little or more information as needed to find the issue.
Initially in SQL Server 2008, extended events came with 253 events. Over time, the extended events architecture become more robust with more events to track. As of now in SQL Server 2016 SSMS, there are 564 events in extended events compared to the 235 in profiler including the reserved event ids.
Extended Events Architecture
Extended events engine by itself does not have any events. The engine is a collection of objects and services. These services and objects enables the definition of events, processing event data and keep a list of sessions.
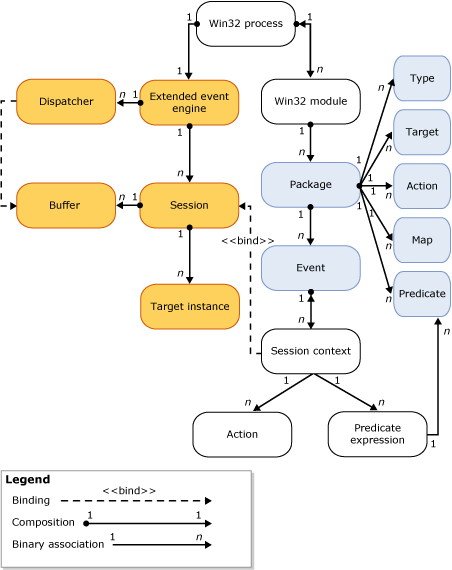
(Image Credit: Microsoft Docs)
Advantages of Extended Events over Profiler
Compared to SQL Server Profiler, Extended Events is,
- Light weight and uses very little resources, but helps to trace and track more.
- It won’t impact the performance of the SQL Servers as profiler does.
- Can trace and track more events than profiler does.
- As on SQL Server 2016, extended events become more robust and the graphical user interface is easy to understand and flexible.
Using Extended Events
With this brief introduction, I would like to show how to use the SQL Server Extended Events through the SSMS in SQL Server 2016. In this illustration, we will create an extended event for tracking the SQL queries and statements which are taking more than 1 second. i.e. tracking the long running queries.
Quick steps to track long running queries using Extended Events
Creating an Extended Events Session
- Login to SQL Server Management Studio (SSMS).
- From the Object Explorer, go to Management > Extended Events > Sessions folder.
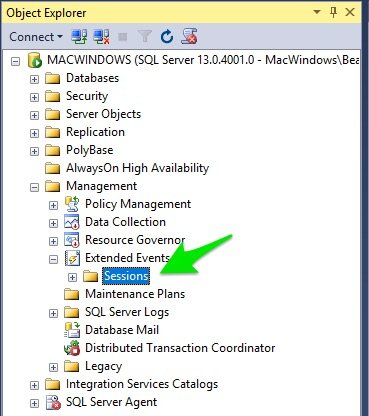
- Right-click Sessions folder. In the right-click menu select New Session...
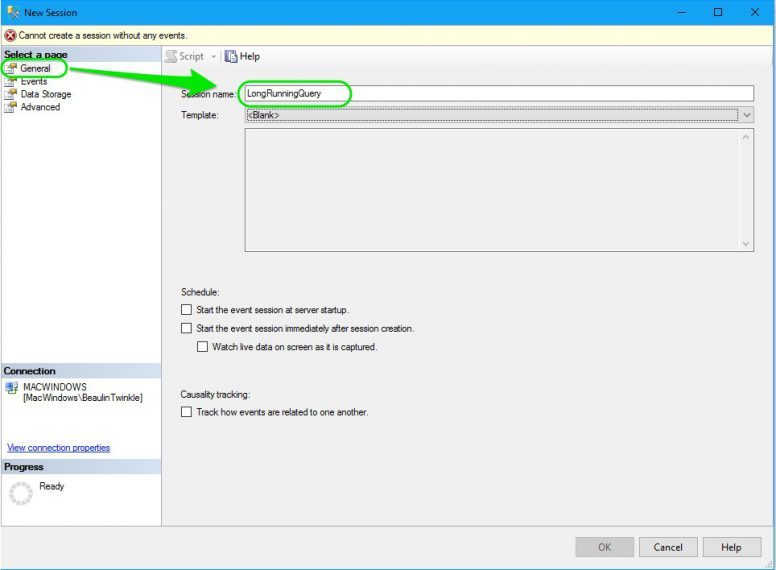
- In the New Session window, select General from the left panel and enter the Session Name. You can name is anything you want. For this illustration, I’ll name it as LongRunningQuery.
- Then, select Events from the left panel. Under the Event Library, in the search box, type in sql_stat. From the filtered events, select sql_statement_completed event and click the right arrow. The sql_statement_completed event is now listed under the Selected events list in the right.
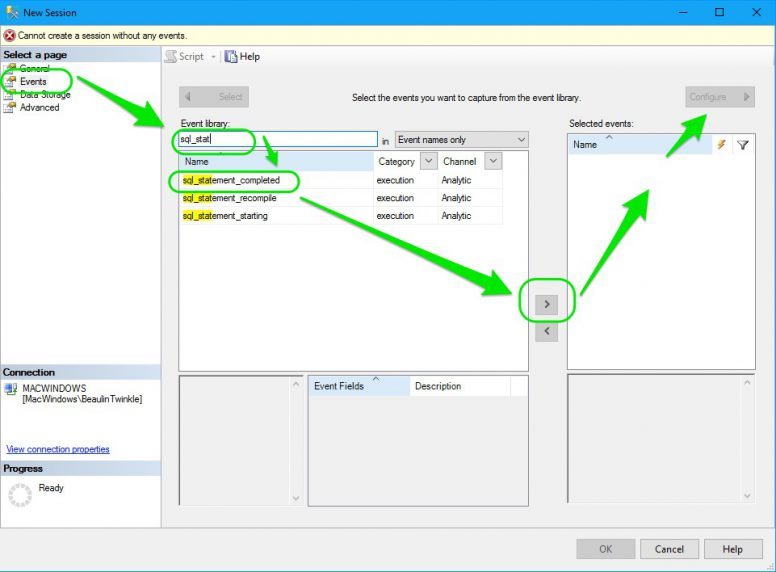
- Now, we need to configure the event and apply filter condition. To configure the event, select the Configure button at the right top. The configuration section will be visible at the right side.
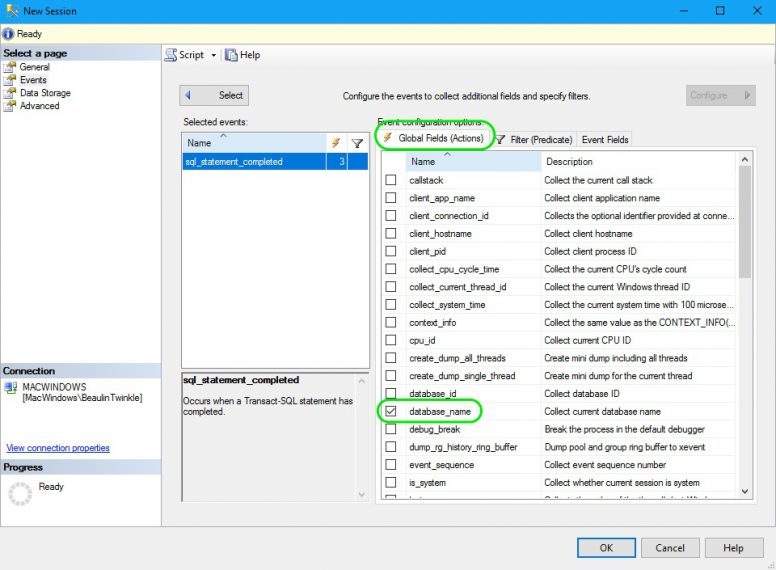
- In the configuration section, under Global Fields (Actions), select the below actions by checking the check box.
- database_name
- session_id
- sql_text
- username
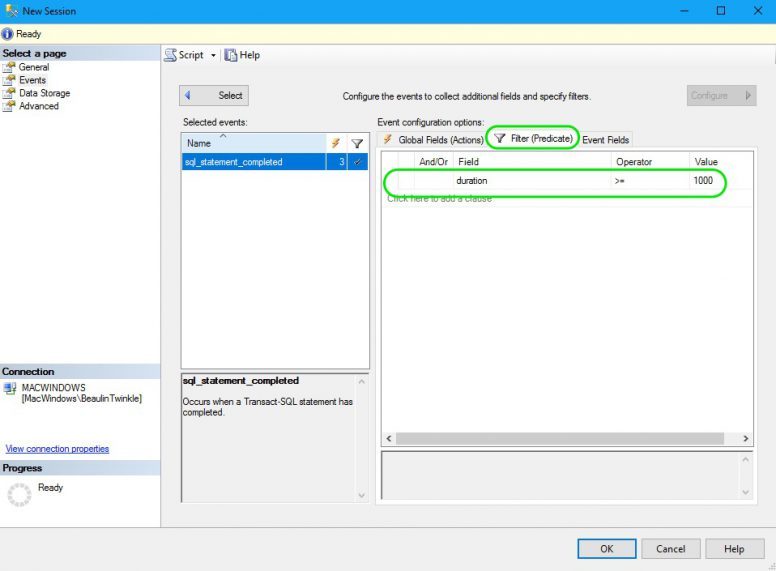
- Now, go the Filter(predicate) panel. Click inside the filter panel to add a filter clause. In Field, select duration. Under operator select >=. Under Value enter 1000. This filter clause will track and collect only the queries which are running for 1000 Milliseconds (1 second) or higher. (DO NOT click the OK button now. We have more settings to do under the Data Storage section.)
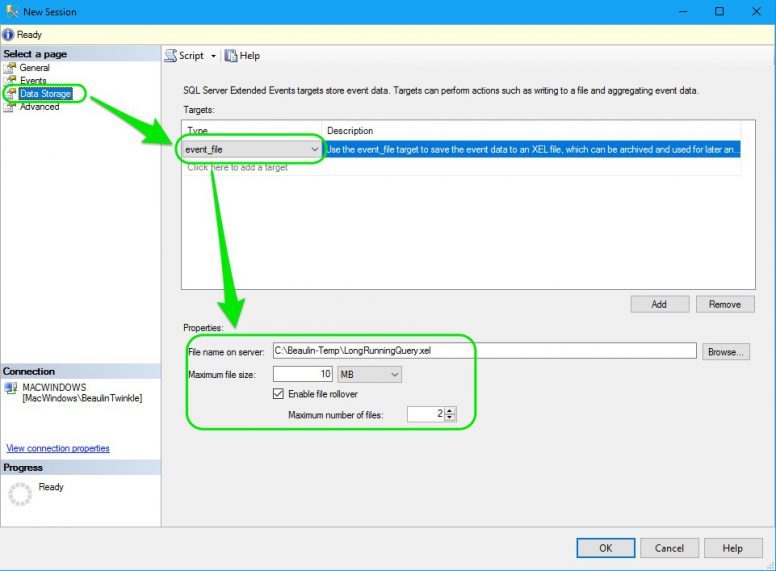
- Select the Data Storage page from the left panel of the New Session screen. In the main panel, under Type, select event_file. Select a folder and file name in File name on server field. Change the Maximum file size if needed. By default the maximum file size will be 1 GB. For this demo I’ve changed it to 10 MB.
- Now, select the Advanced page in the left panel. Change the event retention mode to Multiple event loss. Enter Maximum dispatch latency as 1 second. Change the Maximum event size.
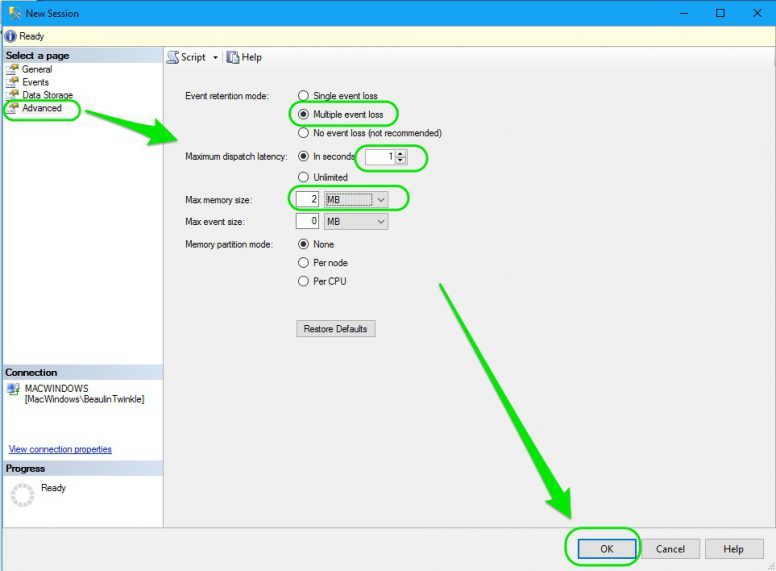
- All the required settings are now completed. Click the OK button.
- Go to Object Explorer > Management > Extended Events > Sessions. You will notice the new session LongRunningQuery.
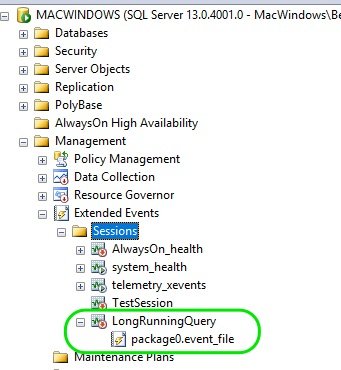
The Extended Event Session is now created.
By default, the session will be in inactive state. Follow the below steps to start the session and track the events.
Starting the Extended Event Sessions & Collecting Data
- To start the session, right-click the session LongRunningQuery in the Object Explorer and select Start Session.
- To see the collected data, double-click on the event file package0.event_file underneath the session. A new query window will open with the list of tracked events along with time-stamp. On selecting an event, you can see the details of the collected data in the result window.
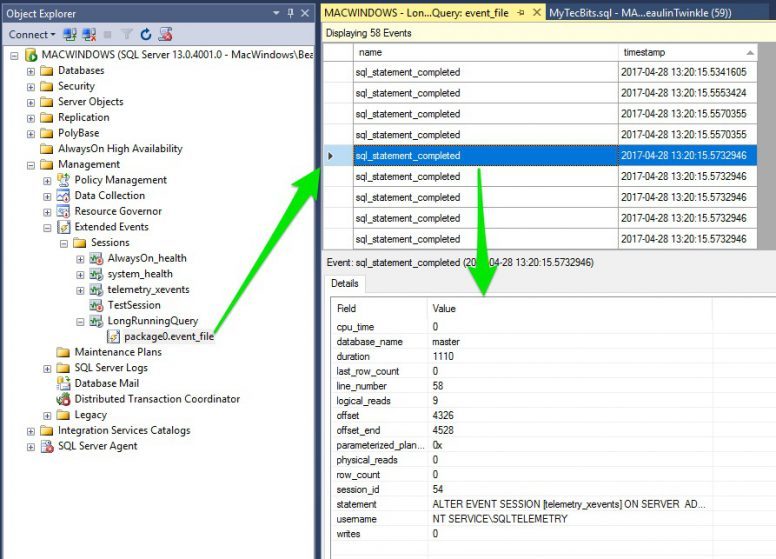
- To stop the session from collecting the data, Right click the session name in object explorer and select Stop Session from the right-click menu.
Thus you can use the SQL Server XEvents instead of SQL Profiler.
Related
- Tracking stored procedures which are running for unusually long time using extended events.
- Identifying and logging blocks and deadlock using XEvents.
Reference
- About SQL Server XEvents Engine at Microsoft Docs.

A good read. Thank you very much for your valuable time and effort for making this article very simple and clear. Once again thank you buddy
You are welcome